
Culture of Quality: Measuring Code Coverage at Etsy

In the summer of 2017, Etsy created the Test Engineering Strategy Team to define, measure, and develop practices that would help product engineering teams ship quality code. One of our first goals was to find a way to establish a quantifiable quality “baseline” and track our progress against this baseline over time. We settled on code coverage because it provides both a single percentage number as well as line-by-line detailed information for engineers to act on. With over 30,000 unit tests in our test suite, this became a difficult challenge.
Code coverage is the measure of how much code is being executed by your test suite. This blog post will walk you through the process of implementing coverage across our various platforms. We are not going to weigh in on the debate over the value of code coverage in this blog post.
We approached measuring code coverage with 5 requirements:
- Generate code coverage metrics by file for PHP, Android, and iOS code bases
- Where possible, use existing tools to minimize impact on existing test and deploy infrastructure
- Create an automated and reliable hands-off process for measurement and reporting
- Surface an accurate measurement as a KPI for code owners
- Promote wide dissemination of the results to increase awareness
Setup and Setbacks
Our first step was collecting information on which tools were already being utilized in our deployment pipeline. A surprise discovery was that Android code coverage had already been implemented in our CI pipeline using JaCoCo, but had been disabled earlier in the year because it was impacting deploy times. We re-enabled the Jenkins job and set it to run on a weekly schedule instead of each deploy to the master trunk. Impact on deployment would be a recurring theme throughout coverage implementation.
There was some early concern about the accuracy of the coverage report generated by JaCoCo. We noticed discrepancies in the reports when viewed through the Jenkins JaCoCo plugin and the code coverage window in Android Studio. We already have a weekly “Testing Workshop” scheduled where these kinds of problems are discussed. Our solution was to sit down with engineers during the workshops and review the coverage reports for differences. A thorough review found no flaws in the reports, so we moved forward with relying on JaCoCo as our coverage generation tool.
For iOS, xcodebuild has built-in code coverage measurement. Setting up xcodebuild’s code coverage is a one-step process of enabling coverage in the target scheme using Xcode. This provides an immediate benefit to our engineers, as Xcode supplies instant feedback in the editor on which code is covered by tests. We measured the performance hit that our unit test build times would take from enabling coverage in CI and determined that it would be negligible. The jobs have a high variance build time with a mean(μ) swing of about 40 seconds. When jobs with coverage enabled were added to the sample, it did not have a noticeable effect on the build time trend. The trend is continually monitored and will be adjusted if the impact becomes detrimental to our deployment process.
Our PHP unit tests were being executed by PHPUnit, an industry standard test runner, which includes an option to run tests with coverage. This was a great start. Running the tests with coverage required us to enable Xdebug, which can severely affect the performance of PHP. The solution was to employ an existing set of containers created by our Test Deployment Infrastructure team for smaller tasks (updating dashboards, running build metric crons, etc.). By enabling Xdebug on this small subset of containers we could run coverage without affecting the entire deployment suite. After this setup was completed, we attempted to run our unit tests with coverage on a sample of tests. We quickly found that executing tests with coverage would utilize a lot of RAM, which would cause the jobs to fail. Our initial attempt to solve the problem was to modify the “memory_limit” directive in the PHP.ini file to grant more RAM to the process. We were allowing up to 1024mb of RAM for the process, but this was still unsuccessful. Our eventual solution was to prepend our shell execution with php -d "memory_limit=-1" to free up all available memory for the process.
Even after giving the process all of the memory available to the container, we were still running into job failures. Checking coverage for ~30,000 tests in a single execution was too problematic. We needed a way to break up our coverage tests into multiple executions.
Our PHP unit tests are organized by directory (cart, checkout, etc.). In order to break up the coverage job, we wrote a simple shell script that iterates over each directory and creates a coverage report.
for dir in */ ; do
  if [[ -d "$dir" && ! -L "$dir" ]]; then
  Coverage Command $dir;
  fi;
  done
Once we had the individual coverage reports, we needed a way to merge them. Thankfully, there is a second program called PHPCov that will combine reports generated by PHPunit. A job of this size can take upwards of four hours in total, so checking coverage on every deploy was out of the question. We set the job to run on a cron alongside our Android and iOS coverage jobs, establishing a pattern of checking code coverage on Sunday nights.
Make It Accessible
After we started gathering code coverage metrics, we needed to find a way to share this data with the owners of the code. For PHP, the combined report generated by PHPCov is a hefty 100mb XML file in the Clover format. We use a script written in PHP to parse the XML into an array and then output that array as a CSV file. With that done, we copy the data to our Vertica data warehouse for easy consumption by our engineering teams.
For iOS, our first solution was to use a ruby gem called Slather to generate HTML reports. We followed this path for many weeks and implemented automated Slather reporting using Jenkins. Initially this seemed like a viable solution, but when reviewed by our engineers we found some discrepancies between the coverage report generated by Slather and the coverage report generated by Xcode. We had to go back to the drawing board and find another solution. We found another ruby gem, xcov, that directly analyzed the .xccoverage file generated by xcodebuild when running unit tests. We could parse the results of this coverage report into a JSON data object, then convert it into CSV and upload it to Vertica.
For Android, the JaCoCo gradle plugin is supposed to be able to generate reports in multiple formats, including CSV. However, we could not find a working solution for generating reports using the gradle plugin. We spent a considerable amount of time debugging this problem and eventually realized that we were yak shaving. We discarded base assumptions and looked for other solutions. Eventually we decided to use the built-in REST api provided by Jenkins. We created a downstream job, passed it the build number for the JaCoCo report, then used a simple wget command to retrieve and save the JSON response. This was converted into a CSV file and (once again) uploaded to Vertica.
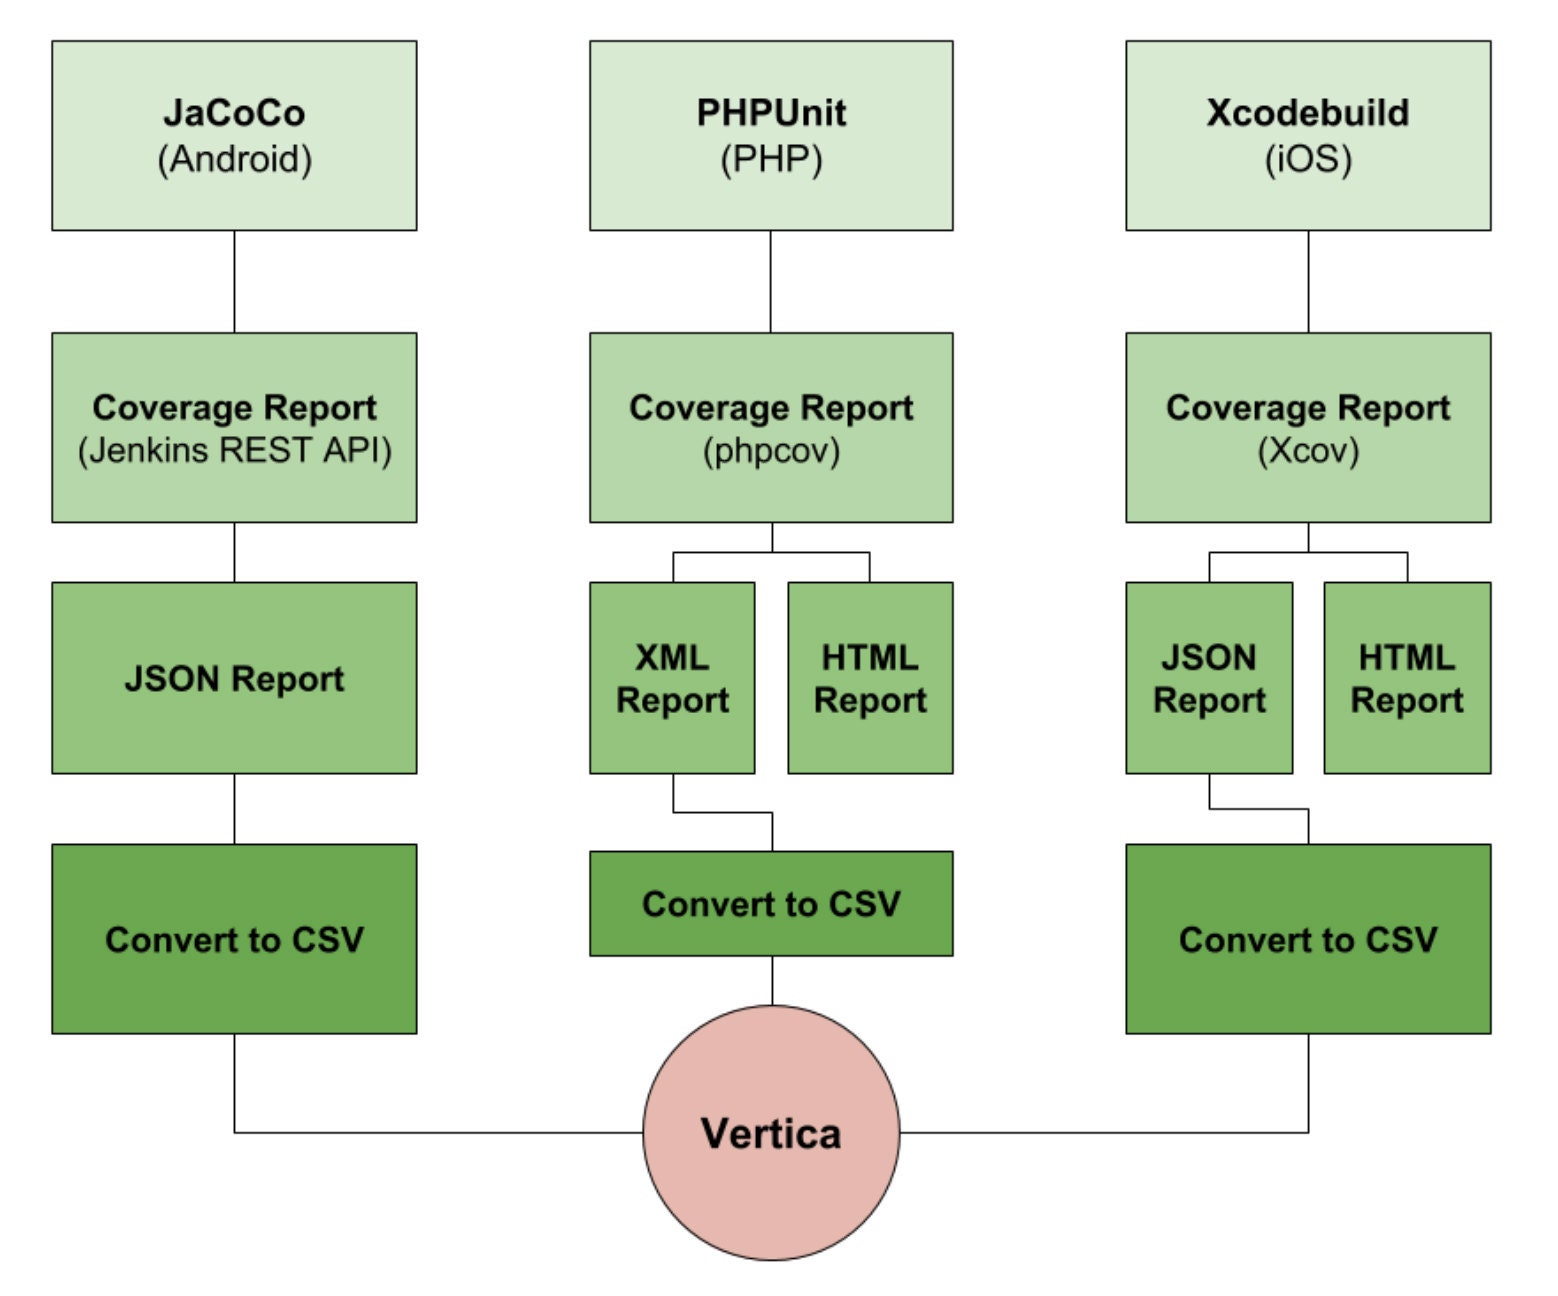
Once we had the coverage data flowing into Vertica we wanted to get it into the hands of our engineering teams. We used Superbit, our in-house business intelligence reporting tool, to make template queries and dashboards that provided examples of how to surface relevant information for each team. We also began sending a weekly email newsletter to the engineering and project organizations highlighting notable changes to our coverage reports.
To be continued...
Measuring code coverage is just one of many methods the Test Engineering Strategy Team is using to improve the culture of quality in Etsy Engineering. In a future blog post we will be discussing the other ways in which we measure our code base and how we use this reporting to gain confidence in the code that we ship.