
Q4 2014 Site performance report

Happy 2015! We’re back with the site performance report for the fourth quarter of 2014.
We’re doing this report a bit differently than we have in the past. In our past reports, we compared metrics collected on one Wednesday in the current quarter to metrics collected on one Wednesday in the previous quarter. In an effort to get a more normalized look at our performance, for this report we’ve taken data across an entire week in December and are comparing it with data from an entire week in October. We plan to continue to explore new methods for discussing our site’s performance over time in future reports, so stay tuned!
In the meantime, let’s see how the numbers look for this quarter. Like last time, different members of the Performance team will write different sections - Natalya will discuss our server side performance, I will cover our synthetic front-end monitoring, and Jonathan will tell us about our real user front-end monitoring.
Server Side Performance - from Natalya Hoota
“Server side” means literally that, time that it takes for a request to execute on the server. We obtained this data by querying our web logs for the requests made on the five popular pages and our baseline page (barebone version of a page with no content except for a header and footer). The median and 95% numbers of our server side performance are presented below.

We did not see any significant trend in the data; both medians and 95% results were relatively flat, with delta less than 5% of a total metric.
What we came to realize, however, is the need to reevaluate both our statistical validity of our data and our measurement approach to make sure we can filter the signal from the noise. We are planning to do so in the Q1 2015 report. There are a few open questions here, for example, what is considered a significant difference, how to deal with seasonality, or what is a better way to represent our findings.
Synthetic Front-end Performance - from Allison McKnight
Here is the synthetic front-end performance data for Q4. This data is collected by Catchpoint running tests on IE9 in New York, London, Chicago, Seattle, and Miami every two hours. Catchpoint’s webpage response metric measures the time from the request being issued until the last byte of the final element of the page is received.

Most of the changes in the median value were attributed to noise. Catchpoint gives us a standard deviation, which we used to calculate error ranges for our median values. The only statistically valid differences were improvements in the homepage web response time and start render time for listing and search pages.
These improvements can be attributed in part to the removal of some resources - serving fewer images on the homepage and the listing page led to a decrease in webpage response time, and two webfonts were removed from the search page.
Real User Monitoring - from Jonathan Klein
Here is the RUM (Real User Monitoring) data collected by mPulse. We measure median and 95th percentile page load time (literally the “Page Load” timer in mPulse).
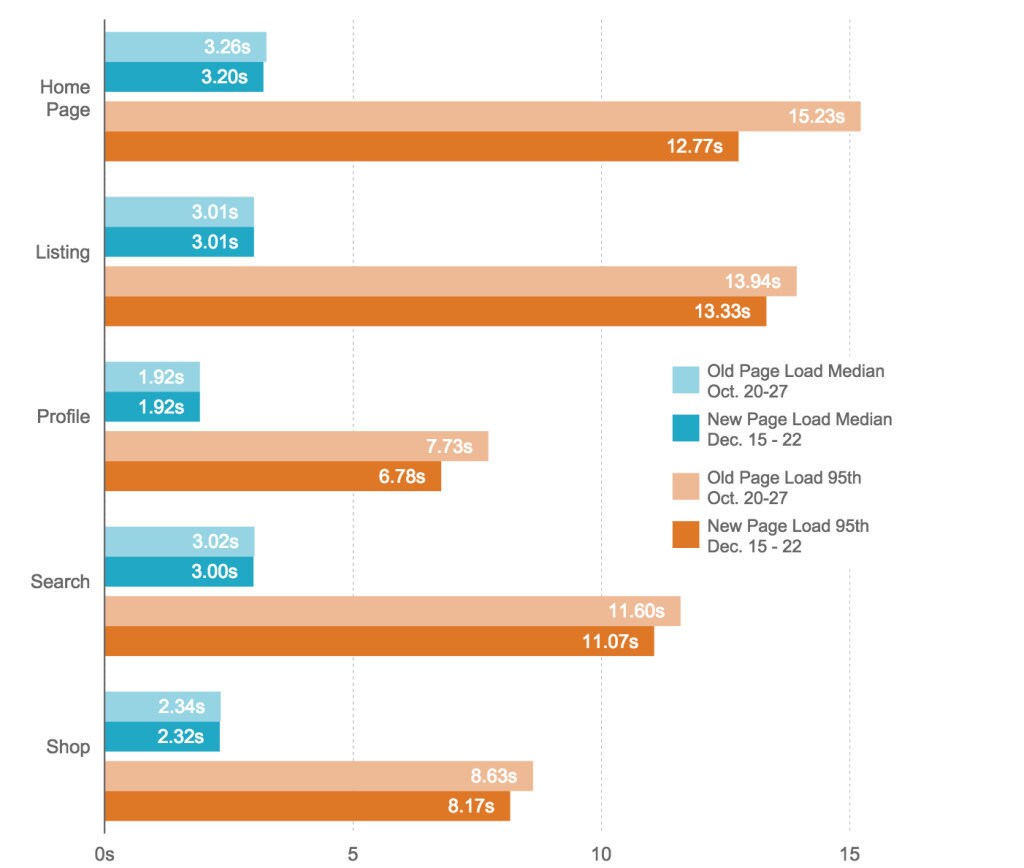
The news here is good, albeit unsurprising. The medians effectively haven't changed since Q3, and the 95th percentiles are down noticeably. The steady medians match what we saw on the synthetic side, which is great to see.
As we mentioned in our last report, we had an issue at one of our CDNs where some CSS files were not being gzipped. This issue was resolved before we pulled this data, and our assumption is that this brought the 95th percentile down. One obvious question is why the homepage had such a large decrease relative to the other pages. We believe this is due to product level changes on our signed-in homepage, but as we mentioned last time we are currently unable to filter signed-in and signed-out users in mPulse. We’ve been told that a feature is on the way to enable that segmentation, and we’ll start differentiating in this report when that happens.
Conclusion- from Natalya Hoota
The last quarter of the 2014 was a relatively quiet time in terms of infrastructure changes, and it showed in the performance metrics. We have seen a slight improvement throughout the site as a result of an experiment with including fewer images and fonts. Fixing a CSS compression bug at one of our CDNs helped our user experience as well.
We would like to find a simple and comprehensive way to represent both the performance trends for the quarter’s duration and give a snapshot of how we are doing at the end of the quarter. Using averages loses details of our users’ experience on the site, and using the daily (and, perhaps, weekly) median taken at the end of the quarter is not taking into account effects that might have occurred during the other parts of the quarter. In the reports to come, we will focus on exploring the methodology of our data collection and interpretation.