
Introducing statsd-jvm-profiler: A JVM Profiler for Hadoop

At Etsy we run thousands of Hadoop jobs over hundreds of terabytes of data every day. When operating at this scale optimizing jobs is vital: we need to make sure that users get the results they need quickly, while also ensuring we use our cluster’s resources efficiently. Actually doing that optimizing is the hard part, however. To make accurate decisions you need measurements, and so we have created statsd-jvm-profiler: a JVM profiler that sends the profiling data to StatsD.
Why Create a New Profiler?
There are already many profilers for the JVM, including VisualVM, YourKit, and hprof. Why do we need another one? Those profilers are all excellent tools, and statsd-jvm-profiler is not intended to entirely supplant them. Instead, statsd-jvm-profiler, inspired by riemann-jvm-profiler, is designed for a specific use-case: quickly and easily profiling Hadoop jobs. Profiling Hadoop jobs is a complex process. Each map and reduce task gets a separate JVM, so one job could have hundreds or even thousands of distinct JVMs, running across the many nodes of the Hadoop cluster. Using frameworks like Scalding complicates it further: one Scalding job will run multiple Hadoop jobs, each with many distinct JVMs. As such it is not trivial to determine exactly where the code you want to profile is running. Moreover, storing and transferring the snapshot files produced by some profilers has also been problematic for us due to the large size of the snapshots. Finally, at Etsy we want our big data stack to be accessible to as many people as possible, and this includes tools for optimizing jobs. StatsD and Graphite are used extensively throughout Etsy, so by sending data to StatsD, statsd-jvm-profiler enables users to use tools they are already familiar with to explore the profiling data.
Writing the Profiler
For simplicity, we chose to write statsd-jvm-profiler is a Java agent, which means it runs in the same JVM as the process being instrumented. The agent code runs before the main method of that process. Implementing an agent is straightforward: define a class that has a premain method with this signature:
package com.etsy.agent;
import java.lang.instrument.Instrumentation;
public class ExampleAgent {
   public static void premain(String args, Instrumentation instrumentation) {
      // Agent code here
   }
}
The agent class should be packaged in a JAR whose manifest specifies the Premain-Class attribute:
Premain-Class: com.etsy.agent.ExampleAgent We are using Maven to build statsd-jvm-profiler, so we use the maven-shade-plugin’s ManifestResourceTransformer to set this property, but other build tools have similar facilities.
Finally, we used the JVM’s management interface to actually obtain the profiling data. java.lang.management.ManagementFactory provides a number of MXBeans that expose information about various components of the JVM, including memory usage, the garbage collector, and running threads. By pushing this data to StatsD, statsd-jvm-profiler removes the need to worry about where the code is running - all the metrics are available in a central location.
Issues
There were some issues that came up as we developed statsd-jvm-profiler. First, statsd-jvm-profiler uses a ScheduledExecutorService to periodically run the threads that actually perform the profiling. However, the default ScheduledExecutorService runs as a non-daemon thread, which means it will keep the JVM alive, even though the main thread may have exited. This is not ideal for a profiler, as it will keep the JVM alive and continue to report profiling data even though nothing is happening other than the profiler. Guava has functionality to create a ScheduledExecutorService that will exit when the application is complete), which statsd-jvm-profiler uses to work around this issue.
Safepoints are another interesting aspect of profiling the JVM. A thread is at a safepoint when it is in a known state: all roots for garbage collection are known and all heap contents are consistent. At a safepoint, a thread’s state can be safely observed or manipulated by other threads. Garbage collection must occur at a safepoint, but a safepoint is also required to sample the thread state like statsd-jvm-profiler does. However, the JVM can optimize safepoints out of hot methods. As such, statsd-jvm-profiler’s sampling can be biased towards cold methods. This is not a problem unique to statsd-jvm-profiler - any profiler that samples the thread state like statsd-jvm-profiler does would have the same bias. In practice this bias may not be that meaningful. It is important to be aware of, but an incomplete view of application performance that still enables you to make improvements is better than no information.
How to Use statsd-jvm-profiler
statsd-jvm-profiler will profile heap and non-heap memory usage, garbage collection, and the aggregate time spent executing each function. You will need the statsd-jvm-profiler jar on the host where the JVM you want to profile will run. Since statsd-jvm-profiler is a Java agent, it is enabled with the -javaagent argument to the JVM. You are required to provide the hostname and port number for the StatsD instance to which statsd-jvm-profiler should send metrics. You can also optionally specify a prefix for the metrics emitted by statsd-jvm-profiler as well as filters for the functions to profile.
-javaagent:/path/to/statsd-jvm-profiler/statsd-jvm-profiler.jar=server=statsd,port=8125An example of using statsd-jvm-profiler to profile Scalding jobs is provided with the code.
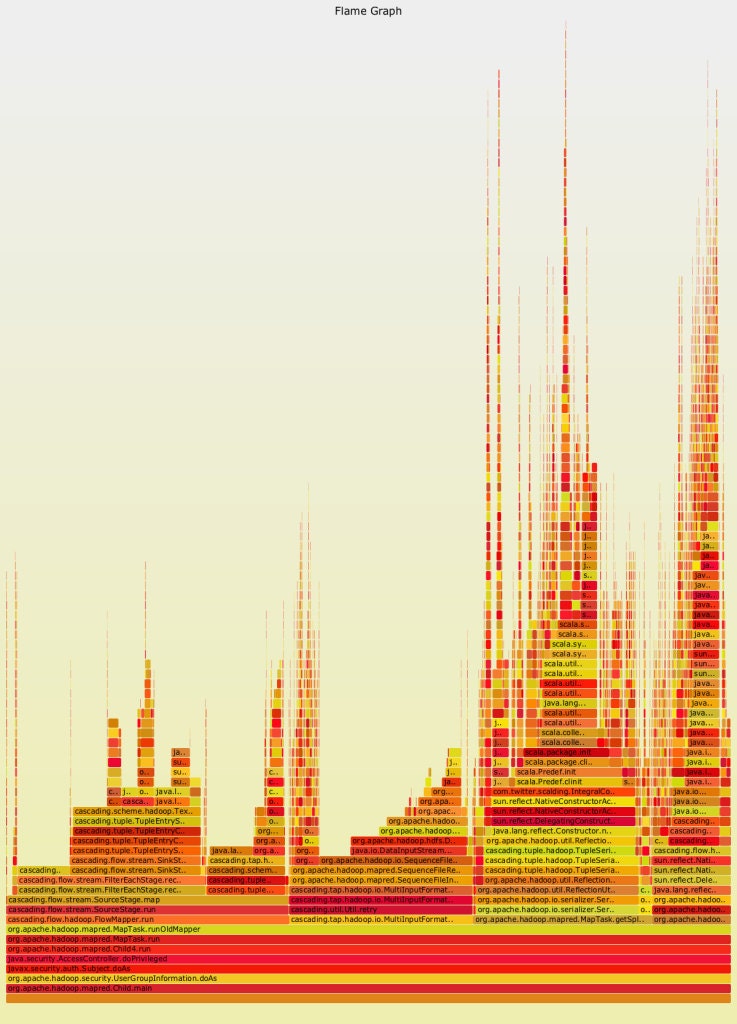
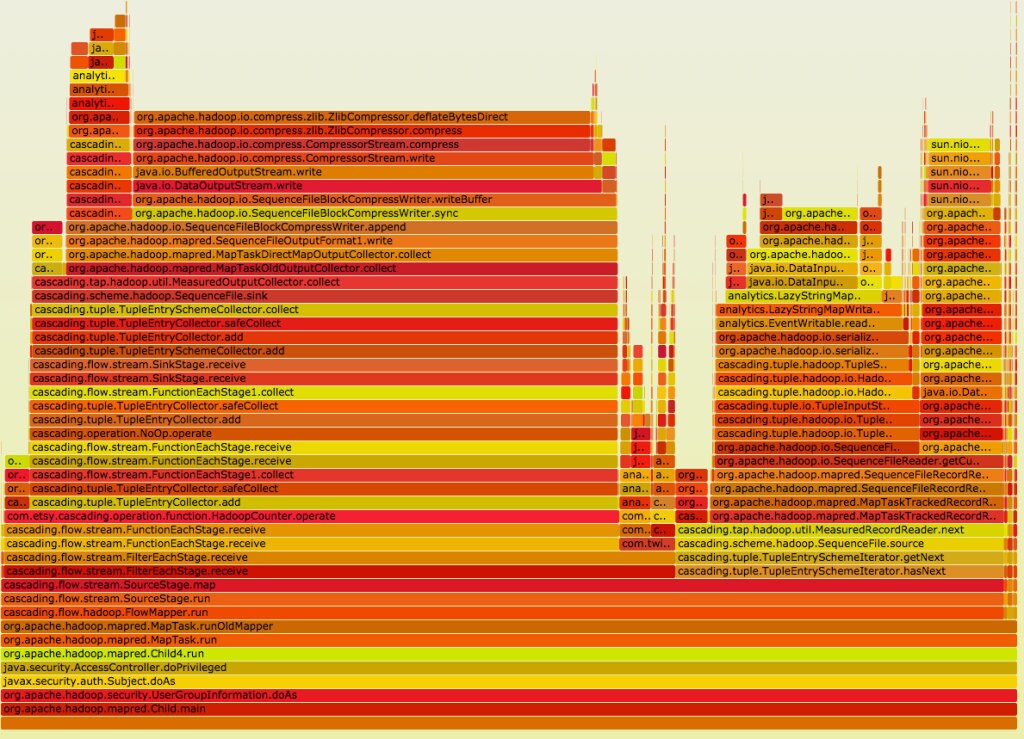
statsd-jvm-profiler will output metrics under the “statsd-jvm-profiler” prefix by default, or you can specify a custom prefix. Once the application being profiled has finished, all of the data statsd-jvm-profiler produced will be available in whatever backend you are using with StatsD. What do you do with all that data? Graph it! We have found flame graphs to be a useful method of visualizing the CPU profiling data, and a script to output data from Graphite into a format suitable for generating a flame graph is included with statsd-jvm-profiler:
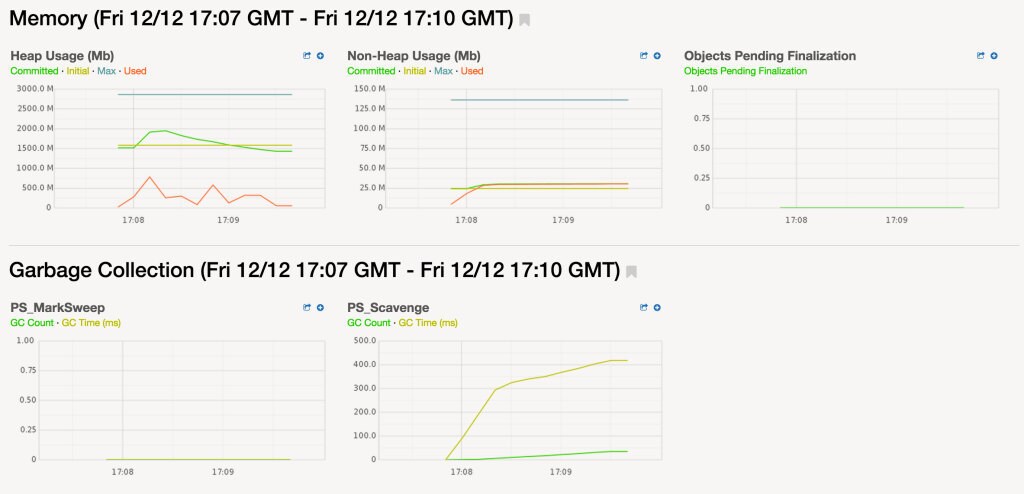
The memory usage and garbage collection metrics can be visualized directly:
Using the Profiler’s Results
We’ve already used the data from statsd-jvm-profiler to determine how best to optimize jobs. For example, we wanted to profile a job after some changes that had made it slower. The flame graph made it obvious where the job was spending its time. The wide bars on the left and right of this image are from data serialization/deserialization. As such we knew that speeding up the job would come from improving the serialization or reducing the amount of data being moved around - not in optimizing the logic of the job itself.
We also made a serendipitous discovery while profiling that job: it had been given 3 Gb of heap, but it was not using anywhere near that much. As such we could reduce its heap size. Such chance findings are a great advantage of making profiling simple. You are more likely to to make these chance discoveries if you profile often and make analysis of your profiling data easier. statsd-jvm-profiler and Graphite solve this problem for us.
Get statsd-jvm-profiler
Want to try it out yourself? statsd-jvm-profiler is available on Github now!