December 2013 Site Performance Report
It’s a new year, and we want to kick things off by filling you in on site performance for Q4 2013. Over the last three months front-end performance has been pretty stable, and backend load time has increased slightly across the board.
Server Side Performance
Here are the median and 95th percentile load times for signed in users on our core pages on Wednesday, December 18th:

There was an across the board increase in both median and 95th percentile load times over the last three months, with a larger jump on our search results page. There are two main factors that contributed to this increase: higher traffic during the holiday season and an increase in international traffic, which is slower due to translations. On the search page specifically, browsing in US English is significantly faster than any other language. This isn’t a sustainable situation over the long term as our international traffic grows, so we will be devoting significant effort to improving this over the next quarter.
Synthetic Front-end Performance
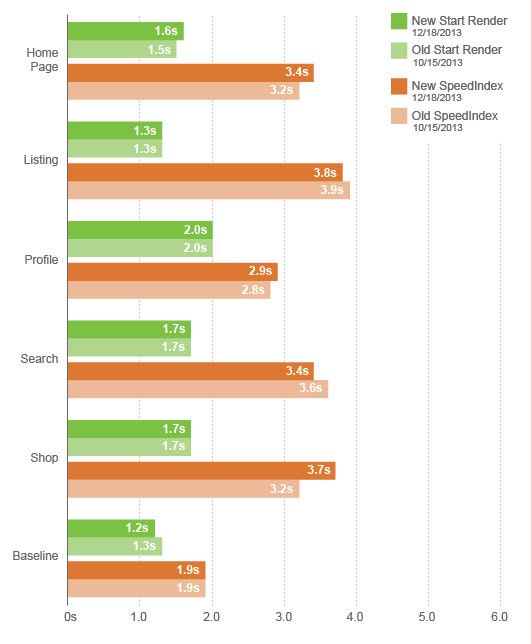
As usual, we are using our private instance of WebPagetest to get synthetic measurements of front-end load time. We use a DSL connection and test with IE8, IE9, Firefox, and Chrome. The main difference with this report is that we have switched from measuring Document Complete to measuring Speed Index, since we believe that it provides a better representation of user perceived performance. To make sure that we are comparing with historical data, we pulled Speed Index data from October for the “old” numbers. Here is the data, and all of the numbers are medians over a 24 hour period:

Start render didn’t really change at all, and speed index was up on some pages and down on others. Our search results page, which had the biggest increase on the backend, actually saw a 0.2 second decrease in speed index. Since this is a new metric we are tracking, we aren’t sure how stable it will be over time, but we believe that it provides a more accurate picture of what our visitors are really experiencing.
One of the downsides of our current wpt-script setup is that we don’t save waterfalls for old tests - we only save the raw numbers. Thus when we see something like a 0.5 second jump in Speed Index for the shop page, it can be difficult to figure out why that jump occurred. Luckily we are Catchpoint customers as well, so we can turn to that data to get granular information about what assets were on the page in October vs. December. The data there shows that all traditional metrics (render start, document complete, total bytes) have gone down over the same period. This suggests that the jump in speed index is due to loading order, or perhaps a change in what’s being shown above the fold. Our inability to reconcile these numbers illustrates a need to have visual diffs, or some other mechanism to track why speed index is changing. Saving the full WebPagetest results would accomplish this goal, but that would require rebuilding our EC2 infrastructure with more storage - something we may end up needing to do. Overall we are happy with the switch to speed index for our synthetic front-end load time numbers, but it exposed a need for better tooling.
Real User Front-end Performance
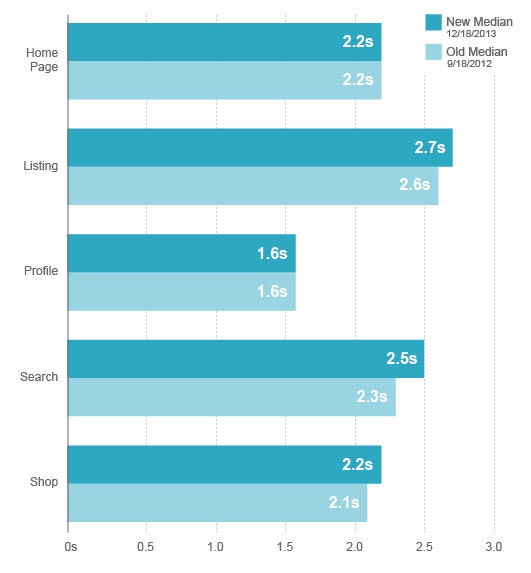
These numbers come from mPulse, and are measured via JavaScript running in real users’ browsers:

There aren’t any major changes here, just slight movement that is largely within rounding error. The one outlier is search, especially since our synthetic numbers showed that it got faster. This illustrates the difference between measuring onload, which mPulse does, and measuring speed index, which is currently only present in WebPagetest. This is one of the downsides of Real User Monitoring - since you want the overhead of measurement to be low, the data that you can capture is limited. RUM excels at measuring things like redirects, DNS lookup times, and time to first byte, but it doesn’t do a great job of providing a realistic picture of how long the full page took to render from the customer’s point of view.
Conclusion
We have a backend regression to investigate, and front-end tooling to improve, but overall there weren’t any huge surprises. Etsy’s performance is still pretty good relative to the industry as a whole, and relative to where we were a few years ago. The challenge going forward is going to center around providing a great experience on mobile devices and for international users, as the site grows and becomes more complex.


