
September 2013 Site Performance Report

As we enter the fourth quarter of 2013, it’s time for another site performance report about how we did in Q3. Our last report highlighted the big performance boost we saw from upgrading to PHP 5.4, and this report will examine a general front-end slowdown that we saw over the last few months.
Server Side Performance
Here are the median and 95th percentile load times for signed in users on our core pages on Wednesday, September 18th:
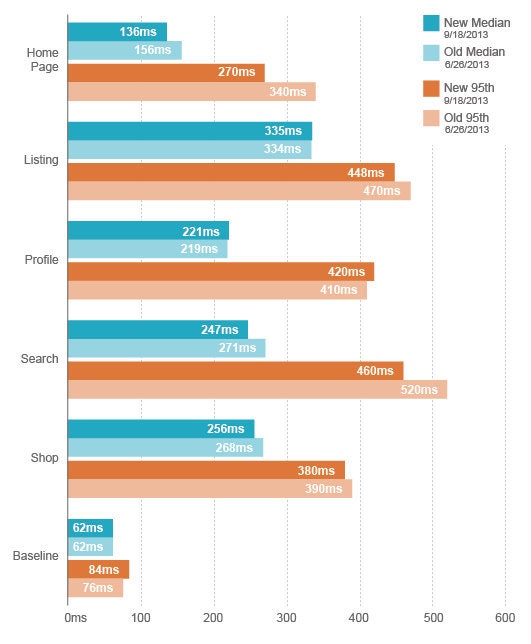 On the server side we saw a modest decrease on most pages, with some pages (e.g. the profile page) seeing a slight increase in load time. As we have mentioned in past reports, we are not overly worried about the performance of our core pages, so the main thing we are looking for here is to avoid a regression. We managed to achieve this goal, and bought ourselves a little extra time on a few pages through some minor code changes. This section isn’t very exciting, but in this case no news is good news.
Synthetic Front-end Performance
The news here is a mixed bag. As usual, we are using our private instance of WebPagetest to get synthetic measurements of front-end load time. We use a DSL connection and test with IE8, IE9, Firefox, and Chrome. The main difference with this report is that we have switched from measuring Document Complete to measuring Speed Index, since we believe that it provides a better representation of user perceived performance. To make sure that we are comparing with historical data, we pulled Speed Index data from October for the “old” numbers. Here is the data, and all of the numbers are medians over a 24 hour period:
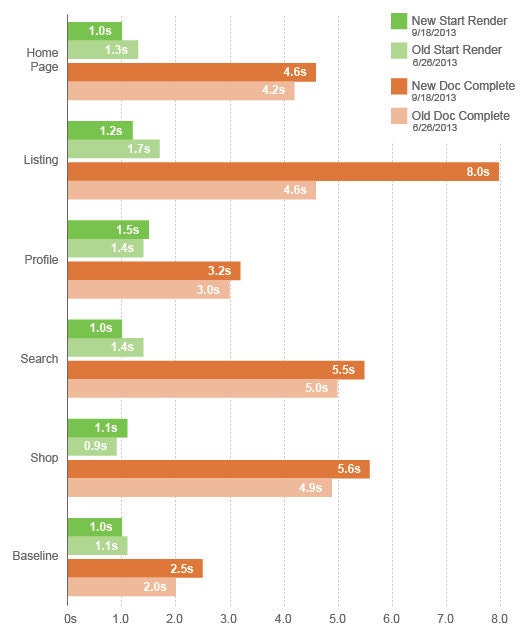
On the plus side, we saw a pretty significant decrease in start render time almost across the board, but document complete time increased everywhere, and increased dramatically on the listing page. Both of these global effects can be explained by rolling out deferred JavaScript everywhere - something we mentioned back in our June report. At that time we had only done it on the shop page, and since then we have put it on all pages by default. This explains the decrease in start render time on all pages except for the shop page. The profile page also had a slight uptick in start render time, and we are planning on investigating that.
One of the side effects of deferring JavaScript is that document complete time tends to rise, especially in IE8. This is an acceptable tradeoff for us, since we care more about optimizing start render, and getting content in front of the user as quickly as possible. We’re also not convinced that a rise in document complete time will have a negative impact on business metrics, and we are running tests to figure that out now.
The massive increase in document complete time on the listing page is due to the rollout of a page redesign, which is much heavier and includes a large number of web fonts. We are currently setting up a test to measure the impact of web fonts on customer engagement, and looking for ways to reduce page weight on the listing page. While document complete isn’t a perfect metric, 8 seconds is extremely high, so this bears looking into. That said, we A/B tested engagement on the old page and the new, and all of the business metrics we monitor are dramatically better with the new version of the listing page. This puts further doubt on the impact of document complete on customer behavior, and illustrates that performance is not the only thing influencing engagement - design and usability obviously play a big role.
Real User Front-end Performance
These numbers come from mPulse and are measured via JavaScript running in real users’ browsers:
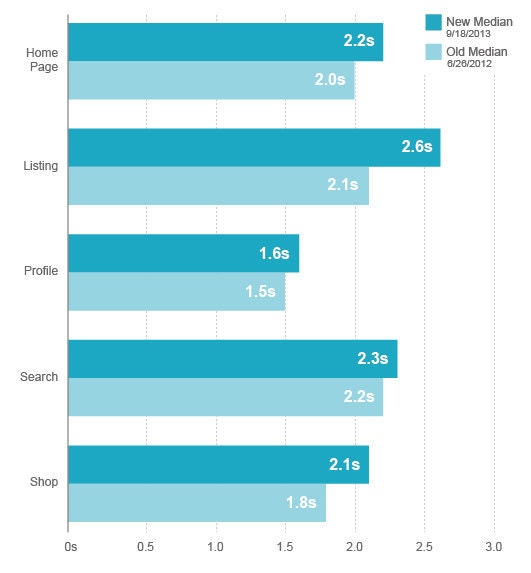
The effect here mirrors what we saw on the synthetic side - a general upward trend, with a larger spike on the listing page. These numbers are for the “page load” event in mPulse, which is effectively the onload event. As Steve Souders and others have pointed out, onload is not a great metric, so we are looking for better numbers to measure on the real user side of things. Unfortunately there isn’t a clear replacement at this point, so we are stuck with onload for now.
Conclusion
Things continue to look good on the server side, but we are slipping on the front-end. Partly this has to do with imperfect measurement tools, and partly it has to do with an upward trend in page weight that is occurring all across the web - and Etsy is no exception. Retina images, web fonts, responsive CSS, new JavaScript libraries, and every other byte of content that we serve continue to provide challenges for the performance team. As we continue to get hard data on how much page weight impacts performance (at least on mobile), we can make a more compelling case for justifying every byte that we serve. You can follow Jonathan on Twitter at @jonathanklein